What Is Water Hardness and How Is It Measured
You measure water hardness by quantifying dissolved calcium and magnesium, reported in ppm (mg/L) or German degrees (dGH). Convert using 1 dGH = 17.848 ppm. Hardness determines scaling, corrosion, and detergent performance. Therefore, you compare consistent units and thresholds: 121–180 ppm often needs a softener.
For treatment, you assess ion-exchange resin capacity, flow rate, salt dose, and brine disposal. More details follow if you keep exploring.
Quick Overview
- Water hardness is the concentration of calcium and magnesium ions in water, usually expressed as ppm (mg/L) or degrees of hardness (dGH, gpg).
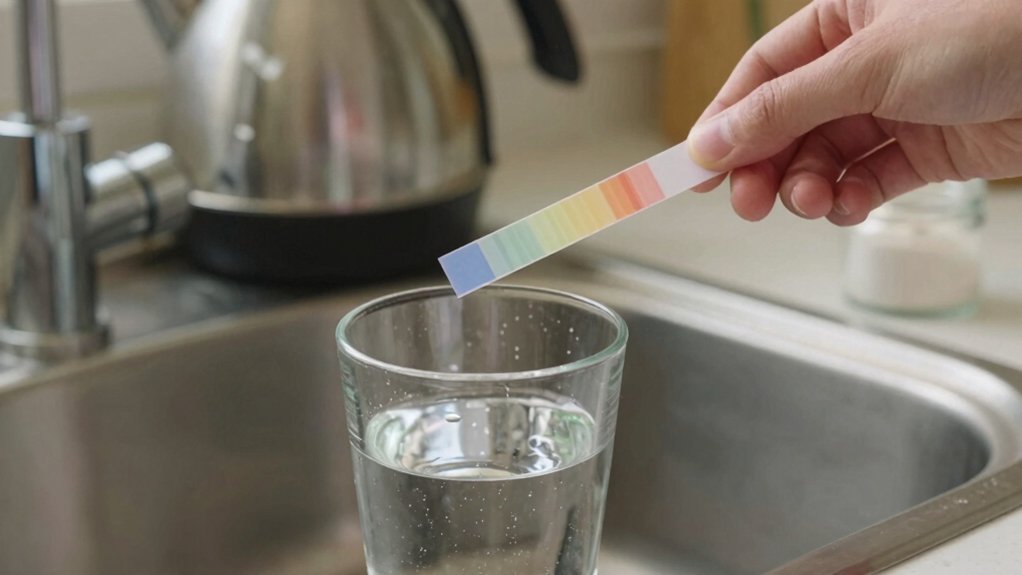
- Hardness is measured by titration with EDTA, colorimetric test kits, or electronic probes calibrated in ppm or dGH.
- Convert units for comparison: ppm = dGH × 17.848; 1 ppm ≈ 0.056 dGH; 1 gpg ≈ 17.118 ppm.
- Interpretation thresholds:
- Treatment and monitoring depend on Ca/Mg contributions, ion-exchange resin capacity, regeneration salt dose, and brine disposal planning.
Ppm vs. dGH Chart
Why convert between ppm and dGH? You need consistent units for hardness conversion when comparing reports, configuring softeners, or assessing scaling risk. Use the exact formula: dGH = ppm / 17.848 and ppm = dGH × 17.848. That gives 1 ppm = 0.056 dGH and 1 dGH = 17.848 ppm; this enables precise ppm vs. dGH comparisons across regions.
| Unit | Equivalent |
|---|---|
| 1 ppm | 0.056 dGH |
| 1 dGH | 17.848 ppm |
| 1 gpg | ~17.118 ppm |
Interpret results against categories:
Calcium & Magnesium Thresholds
Having consistent units like ppm and dGH lets you separate total hardness into its main contributors: calcium and magnesium. You can assess thresholds that affect scaling, treatment, and health concerns. You’ll use calcium thresholds and magnesium thresholds to prioritize mitigation. Calcium often dominates scaling risk; magnesium contributes to soap scum and taste.
Set action levels based on application: plumbing, boiler, or potable water. You should also consider regulatory or operational limits. Analytical methods must quantify each ion precisely to apply thresholds.
- Calcium thresholds: define scaling onset (mg/L as CaCO3) for surfaces and boilers.
- Magnesium thresholds: define corrosion and detergent performance impacts.
- Use EDTA titration with pH partitioning for separation.
- Report in ppm and dGH for comparability.
- Adjust treatment when either exceeds application-specific limits.
Ion Exchange Softening Limits
When you design or operate an ion-exchange softener, you must quantify resin capacity limits and match them to expected hardness loading to avoid premature exhaustion. Pay attention to salt dosage constraints and flow-rate impact; insufficient brine or excessive velocity reduce exchange efficiency and accelerate hardness breakthrough.
Those factors set regeneration frequency tradeoffs that determine operating cost, downtime, and effluent quality.
Resin Capacity Limits
How much softening a given ion-exchange resin can deliver before it needs regeneration depends on its resin capacity, expressed as equivalent weight or as grains per cubic foot (or per liter) of resin. You assess resin capacity against influent hardness and flow to calculate run length and schedule regeneration.
Ion exchange limits are set by exchange sites per unit volume, selectivity for calcium/magnesium, and competing ions. Higher sodium or iron load reduces effective capacity. You’ll convert water hardness (mg/L or GPG) into equivalents to predict exhausted capacity and design resin bed size.
Laboratory capacity tests under representative conditions give reliable numbers; however, field performance may drop due to fouling or channeling. Design margins of 10–20% are common to ensure operational reliability.
Salt Dosage Constraints
Why does salt dosage matter for ion-exchange softening? You control regeneration efficiency and operating cost by matching salt dosage to resin exhaustion and feed hardness. Calculate required grams of NaCl per mole of exchanged Ca2+/Mg2+; adjust for resin type, age, and brine concentration. Quantify breakthrough risk versus salt use.
Practical constraints include maximum achievable exchange given resin bead porosity and hydraulic contact time; these define ion exchange limits and impose minimum salt requirements to fully regenerate sites. Overdosing wastes salt and increases effluent chloride. Underdosing leaves residual hardness and accelerates fouling.
You should monitor treated-water hardness and conduct periodic capacity tests to refine salt dosage. This ensures compliance with discharge chloride limits and optimal ion exchange performance.
Flow Rate Impact
Adjusting salt dosage only solves chemical regeneration; hydraulic conditions set the practical limits of ion-exchange softening. You must size systems so peak flow rate doesn’t exceed contact time required for targeted exchange efficiency.
When flow rate rises, residence time drops, reducing effective utilization of resin capacity and causing incomplete calcium/magnesium removal. You calculate required bed volume from design flow and required service time between regenerations. Then, select resin capacity accounting for expected hardness and fouling.
Pressure drop and channeling at high velocities concentrate flow, lowering apparent capacity and increasing breakthrough risk. Operational controls, such as flow throttling, parallel vessels, or staged softeners, restore adequate contact time. Monitor treated-water hardness and system hydraulics to confirm that practical resin capacity matches hydraulic loading.
Hardness Breakthrough Timing
When will your softener start passing hardness? You calculate breakthrough timing from bed capacity, influent hardness, and service flow. Divide exchange capacity (meq or grains per cubic foot) by influent hardness load (meq/hr or grains/hr) to get theoretical service hours to hardness breakthrough.
Monitor effluent to detect the 0.1–0.2 mg/L CaCO3 rise that denotes initial hardness breakthrough. Account for resin aging: capacity declines with fouling, iron, or oxidative damage; so adjust predicted runtime downward. Temperature, flow distribution, and channeling reduce effective capacity and accelerate breakthrough.
For reliable operation, establish empirical breakthrough curves by periodic effluent testing and track capacity loss over time. Use those curves, not nominal ratings, to schedule regeneration before unacceptable hardness appears.
Regeneration Frequency Tradeoffs
Having established how to predict and monitor breakthrough, you now weigh how often to regenerate resin against operational limits and costs. You evaluate regeneration timing by balancing resin capacity, influent hardness load, and desired effluent specification. Shorter cycles reduce hardness leakage; however, they increase salt, water use, and downtime.
Quantify cycle length from bed volumes to breakthrough criteria. Then, simulate service versus regeneration duty to minimize total cost per cubic metre treated. Factor in labor, chemical procurement, and capital amortization under budget constraints. Compute marginal cost of additional service time versus cost of incremental hardness in product water.
Optimize by sensitivity analysis: vary exchange capacity, salt dose, and cycle time to locate the cost-efficient operating point within process constraints.
Waste Brine Management
How will you manage the concentrated brine stream generated during resin regeneration to meet discharge limits and minimize cost? You’ll quantify waste brine composition—salinity, Ca2+, Mg2+, and metals—then compare against local effluent limits.
Perform mass balances to size brine holding, dilution, or treatment. Disposal options include municipal sewer discharge (with permit), evaporation ponds, deep-well injection, or brine concentration with reverse osmosis/evaporation crystallizers; each has tradeoffs in capital, operating cost, and regulatory risk.
You’ll prioritize source reduction by optimizing salt dose and regeneration frequency to lower brine volume. For constrained sites, consider chemical precipitation to remove hardness before disposal.
Implement monitoring, record keeping, and contingency plans to ensure compliance while minimizing lifecycle cost and environmental impact.
Frequently Asked Questions
Can Water Hardness Affect My Skin or Hair Health?
Yes, hard water can worsen your skin moisture and reduce hair softness by depositing calcium and magnesium salts on surfaces. You’ll notice residue that hinders surfactant rinsing; this residue leaves skin drier and hair stiffer. That residue raises pH at the skin/hair interface, impairing barrier function and conditioning.
Using chelating cleansers, water softeners, or acidic rinses counters mineral buildup and restores hydration and softness.
Does Bottled Water List Hardness on Its Label?
Sometimes. You’ll find bottled water labeling occasionally lists hardness, but it isn’t mandatory.
When producers include it, they often report as mg/L CaCO3 or ppm and may cite hardness measurement methods such as EDTA titration, colorimetry, or TDS-derived estimates.
Check the specification sheet or label for “hardness,” “calcium/magnesium,” or a technical water analysis. If absent, request the lab report from the bottler for precise values.
Can Hard Water Influence Crop Irrigation and Soil Health?
Yes. You’ll see hard water affect crop yield by altering soil structure and nutrient availability. High calcium and magnesium can improve aggregation; however, they can raise soil salinity over time, reducing irrigation efficiency.
Poor water quality with elevated hardness and associated salts can impair root uptake. It can also cause sodium displacement and necessitate leaching or treatment. Monitor EC, SAR, and Ca/Mg ratios to manage irrigation scheduling and safeguard long-term soil health.
How Does Hardness Impact Aquarium Fish and Plants?
Hardness affects aquarium fauna and plant propagation by altering ion balance and carbonate buffering. You’ll see species-specific tolerance: soft-water fish risk osmotic stress in high hardness, while cichlids thrive.
High Ca/Mg promotes robust plant propagation for species needing minerals; however, it can impede CO2 availability and cause bicarbonate toxicity for sensitive plants. You should monitor GH/KH, adjust with remineralizers or RO mixing, and track growth, behavior, and pH stability.
Are Temporary Hardness and Permanent Hardness Different?
Yes, temporary hardness and permanent hardness differ. You will remove temporary hardness (bicarbonate salts of calcium and magnesium) by boiling or adding lime because bicarbonates decompose to insoluble carbonates.
Permanent hardness (sulfates, chlorides) will not precipitate on boiling; you will need ion exchange, reverse osmosis, or chemical softening to remove it.
You will measure both via EDTA titration but separate bicarbonate contribution by alkalinity/pH adjustments to quantify temporary versus permanent hardness.
Conclusion
You now see how hardness, expressed in ppm or dGH, hinges on calcium and magnesium concentrations and how measurement units convert. When softening, you’ll weigh ion-exchange limits, resin capacity, salt dose, and flow rate to predict breakthrough timing and regeneration frequency.
Optimize by matching resin type and salt strategy to your feed hardness to minimize waste brine while maintaining output quality. Apply these thresholds and tradeoffs analytically to meet your system’s performance targets.