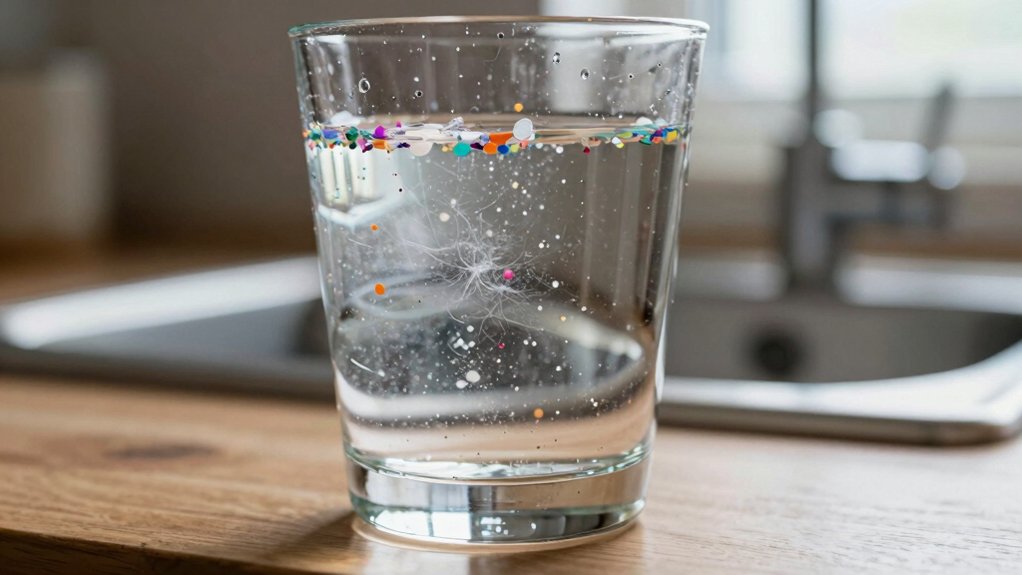
Microplastics in Drinking Water What We Know
You’re likely to find small plastic particles in drinking water, typically spanning Detection varies: methods like micro‑FTIR and digital imaging detect down to ~5–20 µm, while filtration and lab limits shape reported ranges.
Rigorous field blanks, rinsing, airborne controls, and clean containers are essential to avoid contamination. Read on to see practical protocols and regulatory focus.
Quick Overview
- Microplastics are widely detected in drinking water with sizes reported from ~1 µm to millimeters; though measurement limits vary by method.
- Typical analytical methods include micro-FTIR for polymer ID and microscopy; imaging-based DIA detects particles down to ~5–20 µm.
- Field and lab contamination can dominate results. Rigorous field blanks, clean handling, and inert containers are essential.
- Regulatory focus prioritizes ≤1 µm for systemic uptake and 1–100 µm for ingestion and gut-surface effects.
- Reporting should include size ranges, method detection limits, field-blank–corrected counts, and associated uncertainties.
Particle Size Distribution Chart
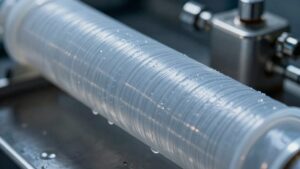
How small are the particles you’re most likely to find in drinking water? You should expect sizes from millimeters down to a few micrometers. Micro-FTIR and Dynamic Image Analysis (DIA) reveal detailed particle distribution and polymer ID. DIA detects particles as small as 5–20 µm; membrane filtration is effective from ~6.5 µm to 1 mm. Heterogeneity is high: sampling variance can yield twofold concentration differences within the same tank or network.
Use the table below to compare common detection ranges and practical limits.
| Method | Detection/Limit |
|---|---|
| Micro-FTIR | AED, length/width, polymer ID |
| DIA | 5–20 µm detection; ~30 particles/mL quantitation |
| Filtration | ~6.5 µm–1 mm retention |
| Field variance | High sampling variance, spatial heterogeneity |
Regulatory Particle-Size Limits
Which particle sizes should regulators target to protect public health? You should focus on regulatory particle size thresholds that capture both micro- (1 µm–5 mm) and nano- (
Prioritize ≤1 µm for systemic uptake and cellular effects. Include 1–100 µm for ingestion and gut-surface interactions. Require reporting ranges rather than single-size cutoffs to reflect measurement limits. Align analytical limits with enforceable regulatory particle size standards and routine monitoring protocols.
You’ll need harmonized methods so limits monitoring yields comparable, actionable data for public-health policy.
Sampling Contamination Control
When you collect drinking-water samples, strict contamination controls are essential to avoid false positives. Implement field blanks, systematic equipment rinsing, airborne particle controls, careful sample container selection, and clothing guidelines so your results reflect ambient water, not sampling artifacts.
These measures are proven to reduce background contamination and improve comparability across studies.
Field Blank Protocols
Because microplastic contamination can be introduced at any step of sample collection, you need a strict field blank protocol to distinguish environmental signals from procedural contamination. You prepare blanks in the field using particle-free water handled and exposed like real samples, labeling chain-of-custody, time, location, and personnel.
Analyze blanks alongside samples to quantify procedural background and subtract it from sample counts, reporting limits and uncertainty. Record discussion ideas about blank frequency, placement (upstream/downstream), and handling to justify representativeness.
Use blanks to detect clothing, airborne, or container-derived fibers without replacing rigorous equipment rinsing procedures. When blanks exceed expected levels, you pause sampling, document corrective actions, and rerun blanks.
Transparent blank data strengthens results, supports regulatory review, and guides reproducible monitoring.
Equipment Rinsing Procedures
Field blanks will tell you whether contamination arose during handling; however, controlling contamination at the source begins with rigorous equipment rinsing procedures. You should rinse all reusable sampling gear with filtered, particle-free water immediately before deployment. Use multiple sequential rinses until rinse water shows no detectable particles under microscopy. When possible, use solvent rinses validated to remove adhesive residues from plastics.
Rinse inside sample containment bags, bottles, and tubing; invert and drain to minimize pooling. Document rinse volumes, methods, and inspection results on chain-of-custody forms. Use single-use, precleaned items where rinsing can’t guarantee cleanliness. Train staff to perform standardized rinses and audits.
Consistent, documented equipment rinsing reduces false positives and strengthens the integrity of microplastic measurements.
Airborne Particle Controls
Airborne microplastics are a major contamination risk during sampling, so you must control room air and personnel to avoid introducing particles into samples. You should implement airborne controls: perform sampling in clean-air cabinets or HEPA-filtered rooms, monitor airborne particle counts during collection, and restrict movement and nonessential personnel.
Wear natural-fiber-free protective clothing and pre-rinse gloves and tools; document clothing and operator actions in field notes. Use blank and field controls to quantify contamination and compare results against method-specific and regulatory limits where available.
If airborne counts approach limits, pause sampling, adjust ventilation, or relocate. Report airborne control measures and blank results transparently so reviewers can assess bias and data quality against expected contamination thresholds.
Sample Container Selection
How will the containers you choose affect contamination and data quality? You must prioritize inert, non-shedding materials (glass or fluorinated HDPE) and avoid plastics that release fibers or additives. Select containers with smooth finishes and validated cleanliness to minimize background counts.
Label and seal samples immediately to prevent airborne ingress; tight closures reduce secondary contamination during transport. Implement rigorous sample container selection criteria in your SOPs and document lot numbers. Pair this with field blank protocols: open, expose, and process blanks at each site to quantify handling and container contributions.
Analyze blanks alongside samples and subtract or flag detected particles statistically. Consistent container choice and disciplined field blank use will improve comparability, traceability, and the credibility of your microplastic concentration data.
Personnel Clothing Guidelines
Why does what you wear matter during sampling? You control a major contamination route: loose fibers and synthetic textiles shed microplastics that skew results. For personnel clothing, wear lint-free, natural-fiber lab coats or certified clean garments. Avoid fleece, wool blends, and synthetic outerwear.
Don disposable, powder-free gloves and change them frequently when handling samples. Tie back hair, minimize accessories, and use dedicated sampling shoes or boot covers. Don’t launder field clothing with household items; use designated wash cycles and cover garments during transport. Document clothing choices in field notes for traceability.
These steps integrate personnel clothing into contamination control, reducing background particle counts and improving data reliability. Follow validated protocols and record deviations immediately.
Laboratory Cleanroom Practices
When you enter a cleanroom for microplastic sampling, treat it as the single most critical control point for preventing sample contamination: maintain positive pressure, HEPA-filtered airflow, and strict gowning protocols so shed fibers and particulates from personnel and equipment never reach samples.
You’ll follow validated entry procedures: don non-woven suits, hair and beard covers, nitrile gloves, and particle-free boot covers. Minimize movement and talking. You’ll use pre-cleaned, metal sampling tools and perform field blanks to quantify cleanroom contamination.
You’ll position samples downstream of HEPA flow and away from doors. You’ll document air particle counts, gowning logs, and microplastic filtration efficiencies for each run. You’ll train personnel on aseptic technique and audit adherence regularly to preserve sample integrity and data reliability.
Frequently Asked Questions
Do Microplastics in Water Penetrate and Accumulate in Human Organs Over Time?
Yes, you can accumulate microplastics in tissues over time. Studies detect microplastics tissue in bloodstream, bone, brain, breastmilk and reproductive organs, indicating accumulation pathways via ingestion, inhalation and translocation across gut or lung barriers.
Evidence links tissue presence to inflammation, organ stress and disease risks; however, dose–response and long-term impacts still need clearer human studies to define thresholds and mechanisms precisely.
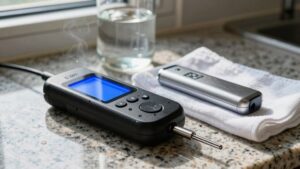
Can Household Water Filters Remove Nanoplastics as Well as Microplastics?
Yes, many household filtration systems remove larger microplastics effectively. However, nanoplastics considerations matter: standard filters (carbon, sediment) often miss nanoparticles. You will need ultrafiltration, nanofiltration, or reverse osmosis to capture nanoplastics reliably.
Look for certified household filtration performance data specifying pore size or particle-removal testing. Regular maintenance and proper installation keep removal effective. Independent lab validation reduces uncertainty about long-term nanoplastics considerations and real-world efficacy.
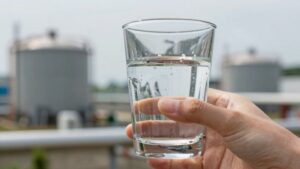
Are Bottled Beverages Safer Than Tap Water Regarding Microplastic Contamination?
No, bottled water isn’t safer. Bottled water vs tap shows higher microplastic concentrations in bottles; though tap’s larger volume raises total exposure. You should trust evidence: bottled water adds production and disposal risks and can increase particles.
Consumer risk perception often favors bottles. However, switching to filtered tap water cuts exposure by over 90%. Use certified filters and avoid bottled beverages when you want to minimize microplastic intake.
What Health Conditions Are Most Strongly Linked to Microplastic Exposure?
You’re most strongly linked to increased risk of cancer, infertility, neurodegenerative disorders (including Parkinson’s and dementia associations), and cardiovascular and kidney disease from microplastics health risks.
Evidence shows particles and additives travel via ingestion and inhalation exposure pathways into the bloodstream, brain, reproductive organs, and breastmilk. This exposure provokes inflammation, chemical toxicity, and organ dysfunction.
Limiting exposure and using effective filters can reduce your overall health burden.
How Can Consumers Reduce Microplastic Intake From Food and Water?
You can cut microplastic intake by changing dietary recommendations into practical consumer choices: eat more whole, unprocessed fruits, vegetables, and grains from fresh sources. Avoid bottled water and use certified filters for tap water. Reduce packaged, salty, sugary foods and honey in plastic containers. Wash synthetic textiles to minimize shedding.
Prioritize reusable, glass or metal storage. These steps are evidence-supported, lower exposure, and address both food and water pathways.
Conclusion
You now have a clear roadmap for characterizing microplastics in drinking water: focus on particle-size distributions, meet regulatory size limits, and control contamination from sampling through analysis. Rinse and blank protocols, careful container selection, airborne controls, and appropriate personnel clothing all reduce false positives.
In the lab, cleanroom practices and documented procedures preserve data integrity. Follow these evidence-based steps consistently to produce reliable, defensible results for monitoring and regulatory decision-making.