Ceramic Water Filters How They Work
You force water through a porous ceramic element that traps particulates and adsorbs some contaminants. Pore sizes (typically 0.05–0.5 μm) determine size-exclusion and microbial retention while porosity controls permeability and flow.
Expect flow ~1.7–3.5 L/h for pot systems. Clean when flow drops 20–30%. Sterilize with compatible agents (0.5–1.0% NaOCl or dilute H2O2) and validate by measuring flow, turbidity, and microbial counts.
Keep going to see detailed maintenance, testing, and design tips.
Quick Overview
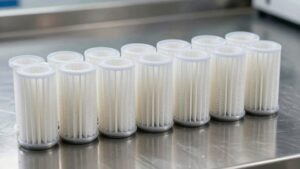
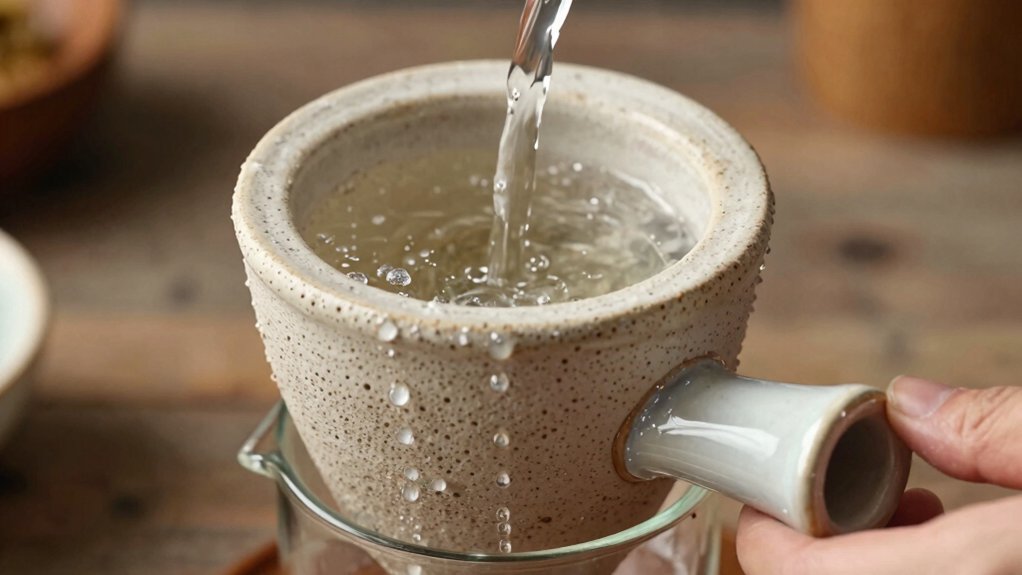
- Water is forced by gravity through a porous ceramic barrier that physically traps particulates larger than the pore openings.
- Ceramic surface adsorption captures some dissolved contaminants and pathogens beyond simple size exclusion. Pore size distribution and integrity determine the micron rating and microbial retention effectiveness.
- Flow rate depends on porosity, pore geometry, tortuosity, and hydraulic head; it is not just dependent on average pore size.
- Regular gentle cleaning and periodic sterilization maintain flow and prevent biofilm-related performance loss.
Porosity vs Flow Rate
Although increasing porosity typically boosts permeability, you shouldn’t assume flow rate will rise proportionally. Between pore size growth from 0.73 to 1.07 μm and porosity increasing from 35.4% to 43.9%, measured flow stayed stable at ~2.5 L/h. Meanwhile, water absorption dropped from 77% to 66%.
You’ll need to evaluate hydraulic conductivity and surface tortuosity. Larger pores reduce capillary retention but may not change net flow if tortuosity or head remains limiting. Use targeted adjustments: modulate pore size distribution rather than bulk porosity to tune flow rate without sacrificing microbial capture.
Compare metrics visually:
| Parameter | Value |
|---|---|
| Pore size (avg) | 0.73 → 1.07 μm |
| Porosity | 35.4% → 43.9% |
| Flow rate | ~2.5 L/h |
| Absorption | 77% → 66% |
Pore Size Vs Micron Rating
How do pore size and micron rating relate, and why does that matter for filter performance? You need clear metrics: pore size defines the physical openings. Micron rating communicates the effective retention threshold. Matching them optimizes contaminant rejection without sacrificing flow rate tied to porosity.
- Measure: pore size (0.05–0.5 μm typical) dictates size exclusion; micron rating quantifies particle retention efficiency.
- Balance: higher porosity increases flow rate but raises effective micron rating unless pore geometry compensates.
- Design: multilayer ceramics and activated carbon cores let you maintain low micron rating while preserving usable flow rate.
Use data on pore distribution and porosity to specify micron rating targets. Then, test gravity or crossflow systems to validate performance.
Cleaning and Sterilization Interval
You should clean ceramic elements when flow rate drops by 20–30% or when you observe visible surface fouling. This typically occurs every 2–8 weeks depending on feed water quality and throughput. Use gentle scrubbing with a soft brush and potable water. Schedule sterilization with an approved agent (e.g., 0.5–1.0% sodium hypochlorite or diluted hydrogen peroxide) at intervals informed by microbial testing or after heavy contamination events.
Handle elements by their collars. Avoid impact or thermal shock; rinse thoroughly after chemical treatment. Document sterilization concentration, contact time, and post-treatment flow recovery.
Recommended Cleaning Frequency
When should you clean a ceramic water filter? You should schedule cleaning based on measured flow decline and usage: monitor liters-per-hour and target restoration thresholds. For gravity pot systems (1.7–3.5 L/hr), clean when flow drops 20–30% versus baseline. For higher-throughput elements, use proportional thresholds.
Track porosity vs flow: higher porosity materials (up to 67.6%) sustain flow longer, but pore size (0.05–0.5 µm) controls fouling rate. Clean externally by gentle scrubbing with a soft brush under clean water; avoid abrading pore walls or removing antimicrobial coatings.
Sterilize monthly if source contamination risk is high, using brief 0.1% chlorine soak or heat protocols compatible with material (check alumina/silicon carbide limits). Log events to optimize intervals.
Signs To Clean
Building on flow-rate monitoring guidelines, recognize specific, measurable signs that tell you to clean or sterilize a ceramic filter: a sustained flow decline of 20–30% from baseline; visible surface fouling or biofilm; effluent turbidity rising above 1 NTU; or a sudden drop in permeate quality (taste, odor, or microbiological test failures).
You should quantify baseline flow under standard head and track deviations weekly. Correlate declines with porosity considerations since pore clogging reduces effective porosity and increases head-loss. Inspect surfaces regularly for biofilm thickness and document turbidity and microbial assay results.
When thresholds are met, act to restore flow optimization and contaminant control. Record cleaning dates, pre/post flow rates, turbidity, and assay outcomes to validate maintenance intervals.
Safe Sterilization Methods
How often you should sterilize ceramic filters depends on measurable indicators and the chosen method. We will tie intervals to those data points: sterilize immediately if you record a sustained flow decline of 20–30% from baseline, effluent turbidity exceeding 1 NTU, positive microbiological tests, or visible biofilm. Otherwise, schedule routine sterilization every 3–6 months for household pot-type systems and monthly for high-use or high-risk installations (healthcare, post-disaster). Industrial crossflow membranes should follow manufacturer-recommended cycles tied to transmembrane pressure and permeability metrics.
You should implement sterilization validation protocols: document pre/post flow, turbidity, and culture results. Use dwell time optimization to maximize kill rates while protecting ceramic integrity. Record contact time, temperature, and concentration metrics per cycle. Monitor trends and adjust intervals based on data.
Sterilization Chemical Options
After you establish sterilization triggers and validation metrics, pick chemical agents that match your filter type and contamination profile while preserving ceramic integrity and flow performance. You’ll evaluate oxidizers (0.5–2% sodium hypochlorite), peracetic acid (100–200 ppm), and hydrogen peroxide (0.5–3%) against biofilm load, endotoxin risk, and silver-impregnated surfaces.
Run compatibility tests; some oxidizers degrade carbon cores or reduce silver efficacy. Define contact time, concentration, and neutralization steps based on measured log reduction targets (≥4-log for bacteria). Track cycle frequency by pressure-drop recovery and microbial load. Typical intervals range weekly to monthly depending on throughput and turbidity.
Document chemical compatibilities, residue limits, and material stress to ensure sterilization chemicals don’t compromise pore structure or long-term flow rates.
Filter Handling Precautions
When should you clean and sterilize a ceramic filter? You should schedule cleaning when measured flow rate drops by 20–30% from baseline or when turbidity downstream increases by >10 NTU. Inspect visually every 4–8 weeks. Perform full sterilization every 3–6 months depending on feedwater quality and porosity tradeoffs: higher porosity tolerates more fouling but requires more frequent sterilization to control biofilm.
For systems operating at low gravity-driven rates (1.7–3.5 L/h), small decreases signal pore blockage sooner. For crossflow designs, monitor differential pressure. Use validated chemical sterilants at manufacturer concentrations; limit exposure time to prevent coating degradation, and rinse thoroughly. Log pre/post-cleaning flow rate impact and turbidity to refine interval frequency based on measured performance.
Post-Sterilization Testing
You’ve already established cleaning and sterilization schedules by monitoring flow-rate decline, turbidity, and visual inspections. Now verify effectiveness through a short, methodical post-sterilization testing protocol. You’ll sample influent and effluent immediately after sterilization, then at 24 and 72 hours. Measure CFU reduction, turbidity (NTU), and flow rate (L/hr).
Target metrics: ≥3 log CFU reduction and turbidity decrease consistent with pre-sterilization baselines. Record porosity vs flow rate data to confirm no irreversible pore enlargement or pore blockage after treatment. Correlate porosity measurements (e.g., mercury intrusion or BET-derived porosity) with observed L/hr. If flow increases disproportionately for a given porosity, inspect for cracks or channeling.
Use these quantitative checkpoints to adjust cleaning intervals and sterilization methods. This will help optimize long-term performance.
Frequently Asked Questions
How Long Do Ceramic Filters Typically Last Before Replacement?
You’ll typically get 1–5 years of lasting lifespan from ceramic filters before replacement, depending on usage, water quality, and coatings. Low-use, well-maintained pot-type elements often reach 2–5 years. However, heavy turbidity or industrial crossflow settings shorten replacement intervals to months–1 year.
Monitor flow rate decline and integrity; replace when flow drops ~50% or cracks appear. Routine cleaning and silver/activated-carbon enhancements extend effective service life.
Can Ceramic Filters Remove Dissolved Salts or Heavy Metals?
No, ceramic filters can’t reliably remove dissolved salts or heavy metals on their own. You’re limited to size-exclusion, adsorption (if activated carbon or specific coatings are present), and ion-exchange only when integrated.
For salt removal, you’ll need reverse osmosis, distillation, or dedicated ion-exchange systems. If you want a can filtration novelty, combine ceramic elements with activated carbon, specific adsorbents, or ion-exchange modules to target metals and achieve measurable reduction.
Are Ceramic Filters Safe for Use With Well Water Containing Chemicals?
Yes, but with limits. You can use ceramic filtration for well water containing chemical contaminants if the system includes adsorptive or ion-exchange stages: activated carbon, specialty resins, or tailored coatings. This is because standard ceramic pores only remove particulates and microbes.
Select multi-stage units tested against target analytes. Verify >90% removal for specific chemicals, monitor breakthrough, and replace cartridges per manufacturer data to maintain performance and safety.
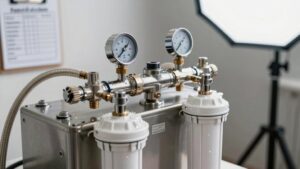
Do Ceramic Filters Require Electricity or Any External Power?
No, you don’t need electric power for typical ceramic pot or gravity filters; they operate passively at about 1.7–3.5 L/hr.
Industrial crossflow variants may use pumps and therefore require power. That means running costs for household ceramic units are minimal: no electricity bills are involved. Costs are limited to periodic element replacement, cleaning, and occasional silver recharging.
For higher-throughput systems, factor pump energy consumption and maintenance into running costs.
Can Ceramic Filters Be Used for Emergency Water Storage and Transport?
Yes, you can use ceramic filters for emergency storage and transport; they’re viable when you plan properly. You’ll get >99.9% bacterial removal and stable TDS over 12 hours. However, you’ll need sturdy containers, secure seals, and silver‑impregnated or carbon‑coated elements to prevent regrowth and odor.
For transport viability, mount filters inside sealed vessels or use cartridge housings to avoid shocks. Monitor flow (1.7–3.5 L/hr) and replace elements per performance data.
Conclusion
You’ve seen how porosity, pore size and micron rating drive flow and contaminant capture, and why routine cleaning and sterilization preserve performance. Act on data: clean when flow drops by approximately 20–30% or turbidity rises. Sterilize with heat or validated chemicals; then verify with a basic turbidity or bacterial test.
Follow handling precautions to avoid recontamination. With scheduled maintenance and post-sterilization testing, you’ll reliably restore design flow and pathogen reduction to spec.